Streamlining Financial Planning: How CFOs Can Benefit from Integrated Variance Dashboards
In today’s fast-paced business environment, Chief Financial Officers (CFOs) are increasingly expected to go beyond traditional accounting—they’re strategic decision-makers, risk managers, and efficiency champions. Integrated variance dashboards—integrated financial planning dashboards—have emerged as a powerful tool in this evolution. These dashboards can transform a CFO’s planning cycle and decision-making capabilities by consolidating data, automating variance analysis, and offering real-time insights. This article explores how CFOs can benefit from integrated variance dashboards.
1. The Expanding Role of the CFO
The CFO’s role has dramatically shifted from a transactional clipboard—closing books and producing reports—to a strategic partner influencing growth and performance.
- A global survey of nearly 600 CFOs found 82% say their role has significantly expanded in the past five years.
- Meanwhile, 81% of CFOs now consider themselves primary drivers of business growth.
This expanded remit requires broad visibility into financial operations, and integrated variance dashboards deliver precisely that.
2. What Are Integrated Variance Dashboards?
An integrated variance dashboard dynamically compares actual financial performance to budgets, forecasts, and prior years across departments, projects, and time periods. Key features include:
- Real‑time data integration from ERP, accounting, CRM, and HR systems.
- Visual variance indicators, often with traffic lights or percentage deviations.
- Drill‑down capabilities, letting users explore the causes behind variances.
By making discrepancies and trends clearly visible, CFOs can quickly understand what’s driving performance and where corrective action is required.
3. Top Benefits for CFOs
A. Real-Time Decision-Making
- 89% of finance leaders make decisions based on incomplete or inaccurate data. Integrated dashboards address this by delivering real-time, validated data.
- According to McKinsey, companies using data analytics are twice as likely to outperform peers in profitability.
B. Enhanced Forecast Accuracy
- Cloud-based FP&A tools are projected to grow from $3.9 B in 2023 to $9.7 B by 2031 (CAGR 16.4%).
- 66% of finance leaders believe Gen AI will have the biggest near‑term impact on forecasting and budgeting variance.
C. Better Cash Flow Management
- Automated dashboards help reduce days sales outstanding (DSO) and days inventory outstanding (DIO) by enabling proactive adjustments.
- Governance becomes easier: one advisory noted that automation can reduce human error by up to 90%.
D. Streamlined Reporting
- Traditional reporting cycles take days or weeks. With integrated dashboards, data is updated continuously, allowing report generation in minutes.
- This frees finance teams to focus on analysis and strategic insights instead of tedious data entry.
E. Cross-Functional Alignment
- Studies show only 37% of CFOs collaborate seamlessly with sales, and 35% with marketing. Integrated dashboards democratize financial data across the organization, encouraging shared understanding.
- Visual dashboards boost decision-making accuracy by 10-30% according to Accenture.
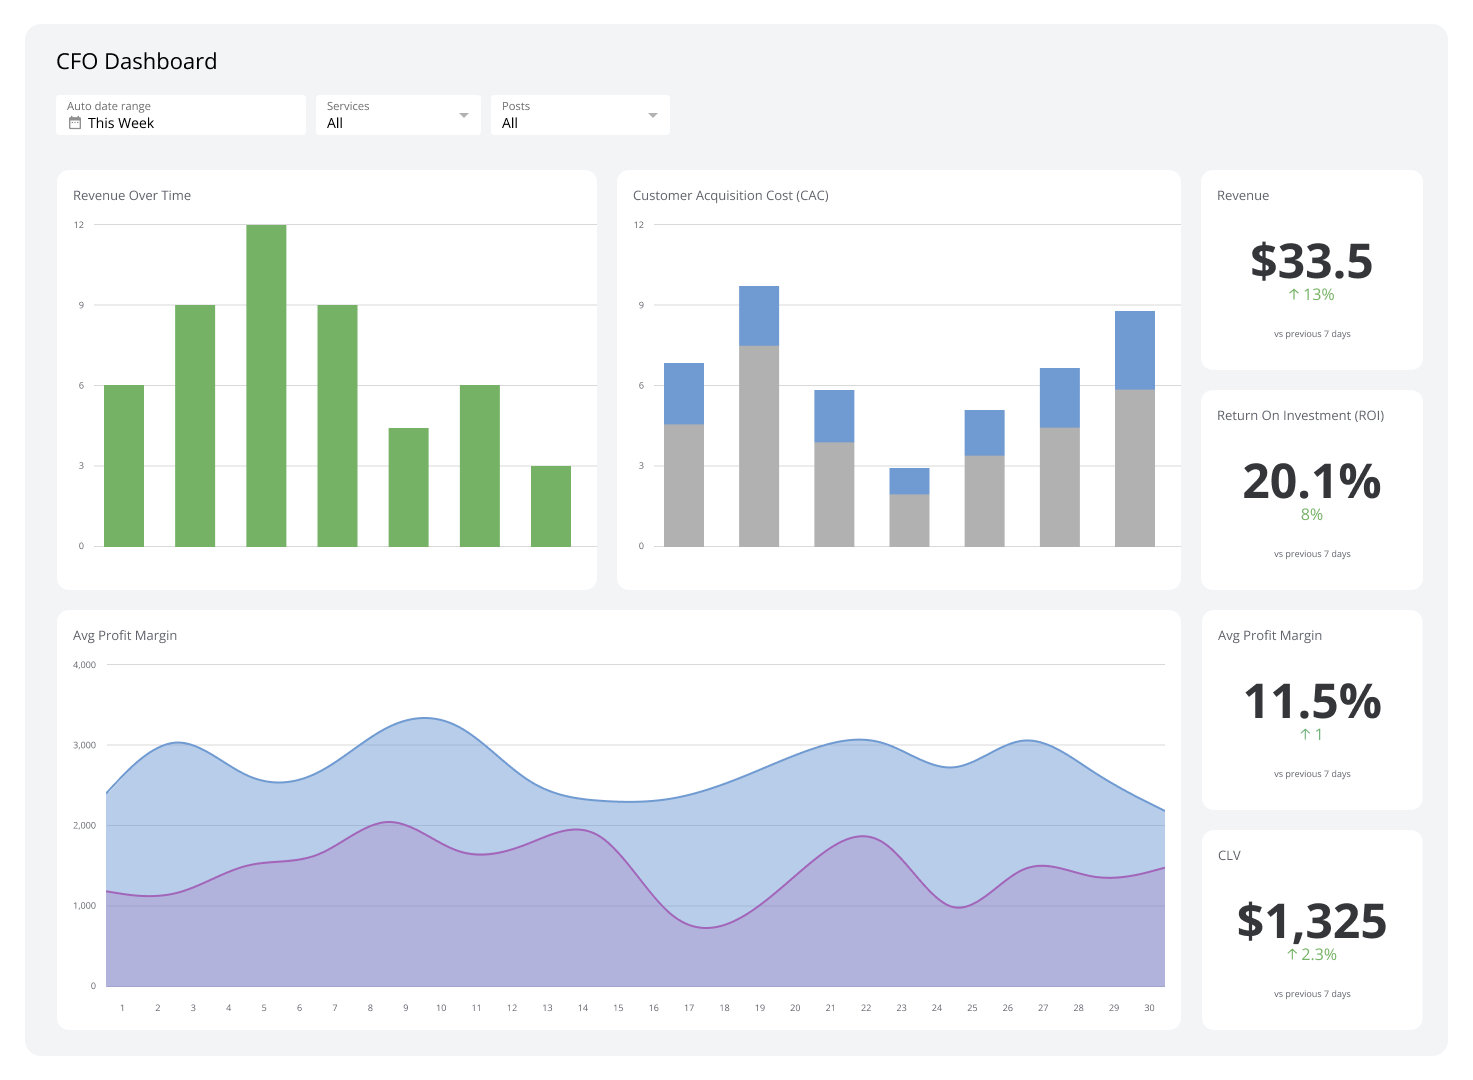
4. Common CFO Dashboard Metrics
Integrated dashboards typically track these critical KPIs:
| KPI | Purpose |
| Budget vs Actual Variance (%) | Measures financial health vs plan, highlights deviations |
| Revenue Growth Rate (%) | Tracks business expansion |
| Gross & Net Profit Margin (%) | Monitors profitability efficiency |
| Operating Cash Flow | Ensures liquidity and solvency |
| Current Ratio | Tests short-term financial resilience |
| DSO & Inventory Days | Improves working capital management |
| Operational Expenses by Category | Identifies inefficiencies and cost overruns |
Integrated dashboards not only track these but also allow drill-down into monthly, departmental, or project-level variances.
5. Implementation Best Practices
To maximize the impact of integrated variance dashboards, CFOs should:
- Define Clear Objectives and KPIs
Select metrics aligned with strategic goals—avoid clutter by focusing on what matters.
- Ensure Seamless Data Integration
Connect ERP, CRM, HR, etc.—modern ERPs like NetSuite, Sage Intacct, and SAP have APIs compatible with BI tools.
- Embrace Visualization and Interactivity
Use color-coded variances and drill-down interactive charts to simplify analysis. This provides visual stimuli and ease of understanding for the onlookers.
- Foster a Data-Driven Culture
Encourage stakeholders to use shared dashboards—only 12% of CFOs cited change management as a transformation challenge.
- Iterate and Refine Continuously
Regularly reassess dashboards, KPIs, and user experience.
6. Integrated Dashboards & Strategic Planning
Integrated variance dashboards support Integrated Business Planning (IBP), which harmonizes operational, financial, and strategic plans. IBP aligns timelines, forecasts, and departmental inputs.
By enabling scenario planning, rolling forecasts, and what‑if simulations, CFOs can:
- Test new investments or cost controls
- Evaluate forecast impact immediately
- Develop agile responses to external factors like inflation or supply chain shocks
7. Why Choose Bunker?
When selecting tools to build integrated dashboards, CFOs often turn to robust modern software—like bunker software—to accelerate deployment and ensure accuracy. Bunker offers:
- Smart spreadsheets with embedded variance dashboards
- Ready-to-use templates for budgeting, variance analysis, and FP&A
- API integrations for ERP/BI tools to eliminate manual data handling
- Collaboration features enabling finance teams to work in sync
With Bunker, CFO teams can quickly deploy dashboards with built-in workflows, saving time and improving financial governance.
8. Impact & ROI
Integrated variance dashboards deliver quantifiable benefits:
- Up to 55% increase in profitability reported by firms using advanced analytics.
- DSO reductions of 20–30% through real-time cashflow monitoring.
- Forecasting cycles reduced from weeks to days, boosting agility and decision speed.
- FP&A software adoption is expected to grow to nearly $9.7B by 2031, exemplifying CFOs’ prioritization of these tools.
9. Case Example: CFO of Manufacturing Co.
Consider a mid-sized manufacturer that implemented an integrated variance dashboard:
- Real-time tracking of departmental costs led to a 15% cut in operational expenses.
- Cashflow variances were flagged earlier, reducing DSO by 22% over one year.
- Forecasts became dynamic through rolling updates, enabling swift responses to market changes.
Such outcomes underscore the tangible value—cost savings, cash efficiency, strategic agility—delivered by dashboard-driven finance.
Conclusion
Integrated variance dashboards are no longer a luxury—they’re a strategic imperative. They empower CFOs to make real-time decisions, align cross-functional teams, refine forecasts, and optimize cash flow. With statistics underscoring ROI—from profitability gains to forecasting accuracy—adoption is accelerating.
By choosing strong tools like bunker software, CFOs can deploy dashboards effectively, streamline FP&A, and maintain a vibrant, data-led finance function.
Elevate your financial planning by embracing integrated variance dashboards—and discover the edge Bunker can bring to your organization.
Whether you’re evaluating dashboard platforms or ready to elevate your financial operations, integrated variance dashboards offer a proven path to higher profitability, better resource allocation, and strategic agility.